How Thorn provides deep insights into what the Bramble compiler is doing.
Thorn is the insights platform that enables exploration into exactly what the Bramble compiler does with your code and why. It is inspired by the question of what would happen if a compiler was built with the goal of providing Compiler Explorer out of the box and times a thousand.
Currently, Thorn is in the MVP stage. It comprises a small project server that allows queries into the audit data generated by the Bramble compiler when insight recording is turned on and a web front end that allows you to explore that data in a pleasant visual form.
To tell Bramble to generate a Thorn insight record, simply add this CLI
parameter: --json-trace. The Bramble compiler will then save a JSON
file with the full insight record to the ./target/ directory.
Thorn Features
-
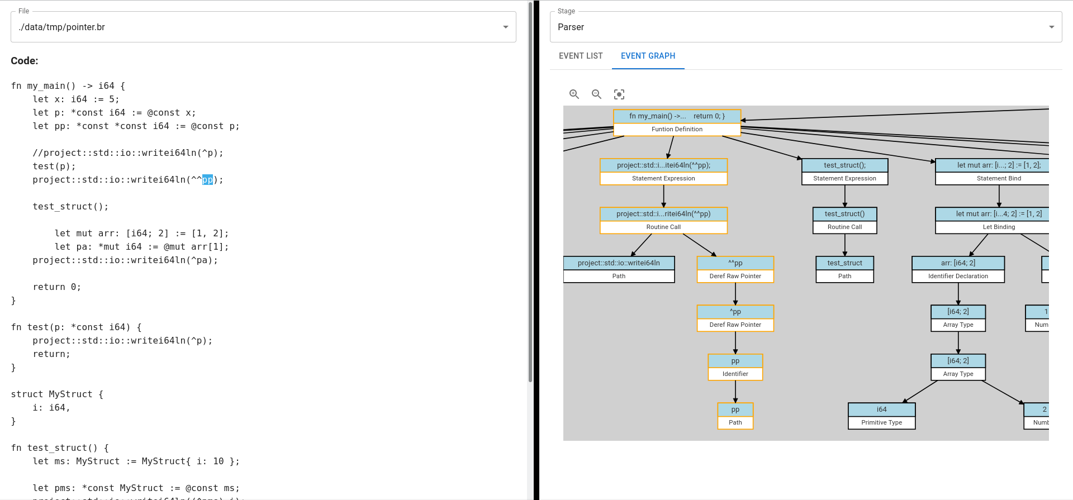
Here’s a visualization of the AST generated by the Bramble Compiler for a small program:

The user has selected an expression and the corresponding subtree has been highlighted. Helping the viewer investigate how the compiler sees their code.
-
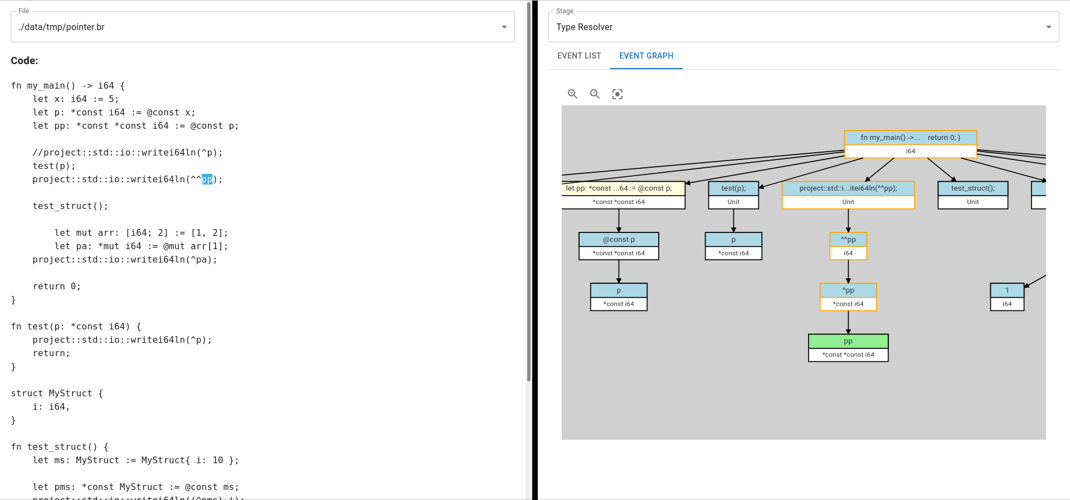
And here’s an example of the type resolution for every expression in a program:

Here, Thorn provides a breakdown of how the type of the selected expression was resolved. The declaration of `pp` is highlighted in yellow to tell the user that Bramble used the delcaration to provide context when it was resolving the type.
-
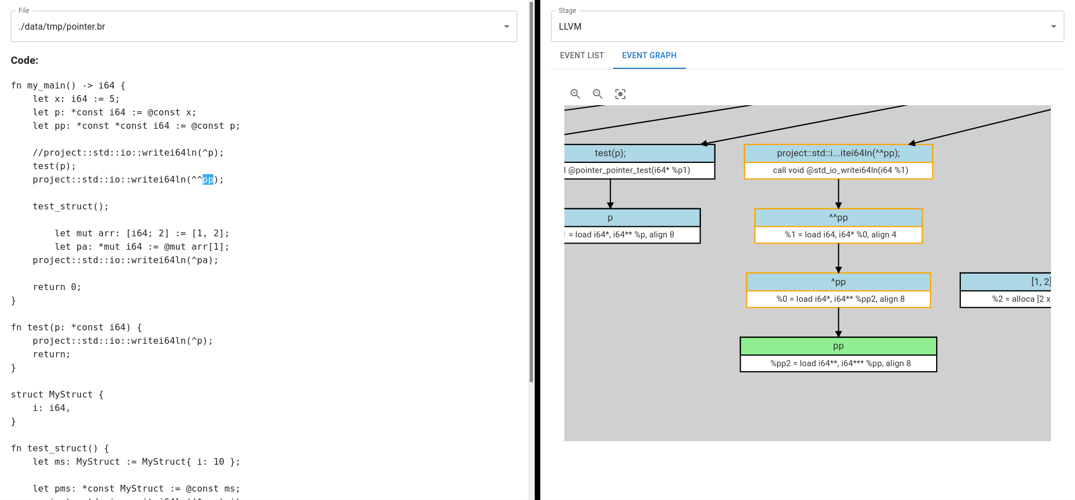
And here’s a beakdown of how the same expression was transpiled into LLVM:

-
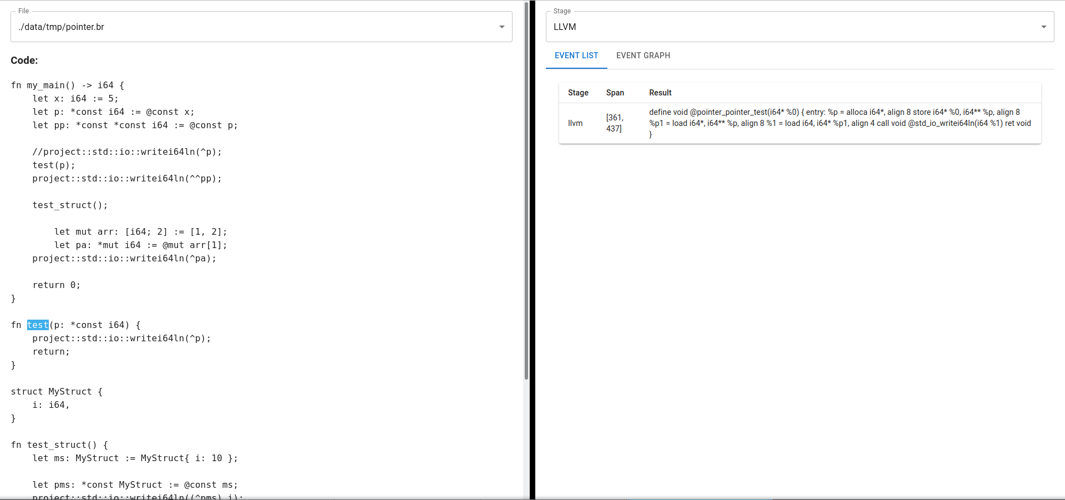
And a different view showing the LLVM IR for the selected function:
